
TransMilenio's 5-year Plan to Upgrade Stations
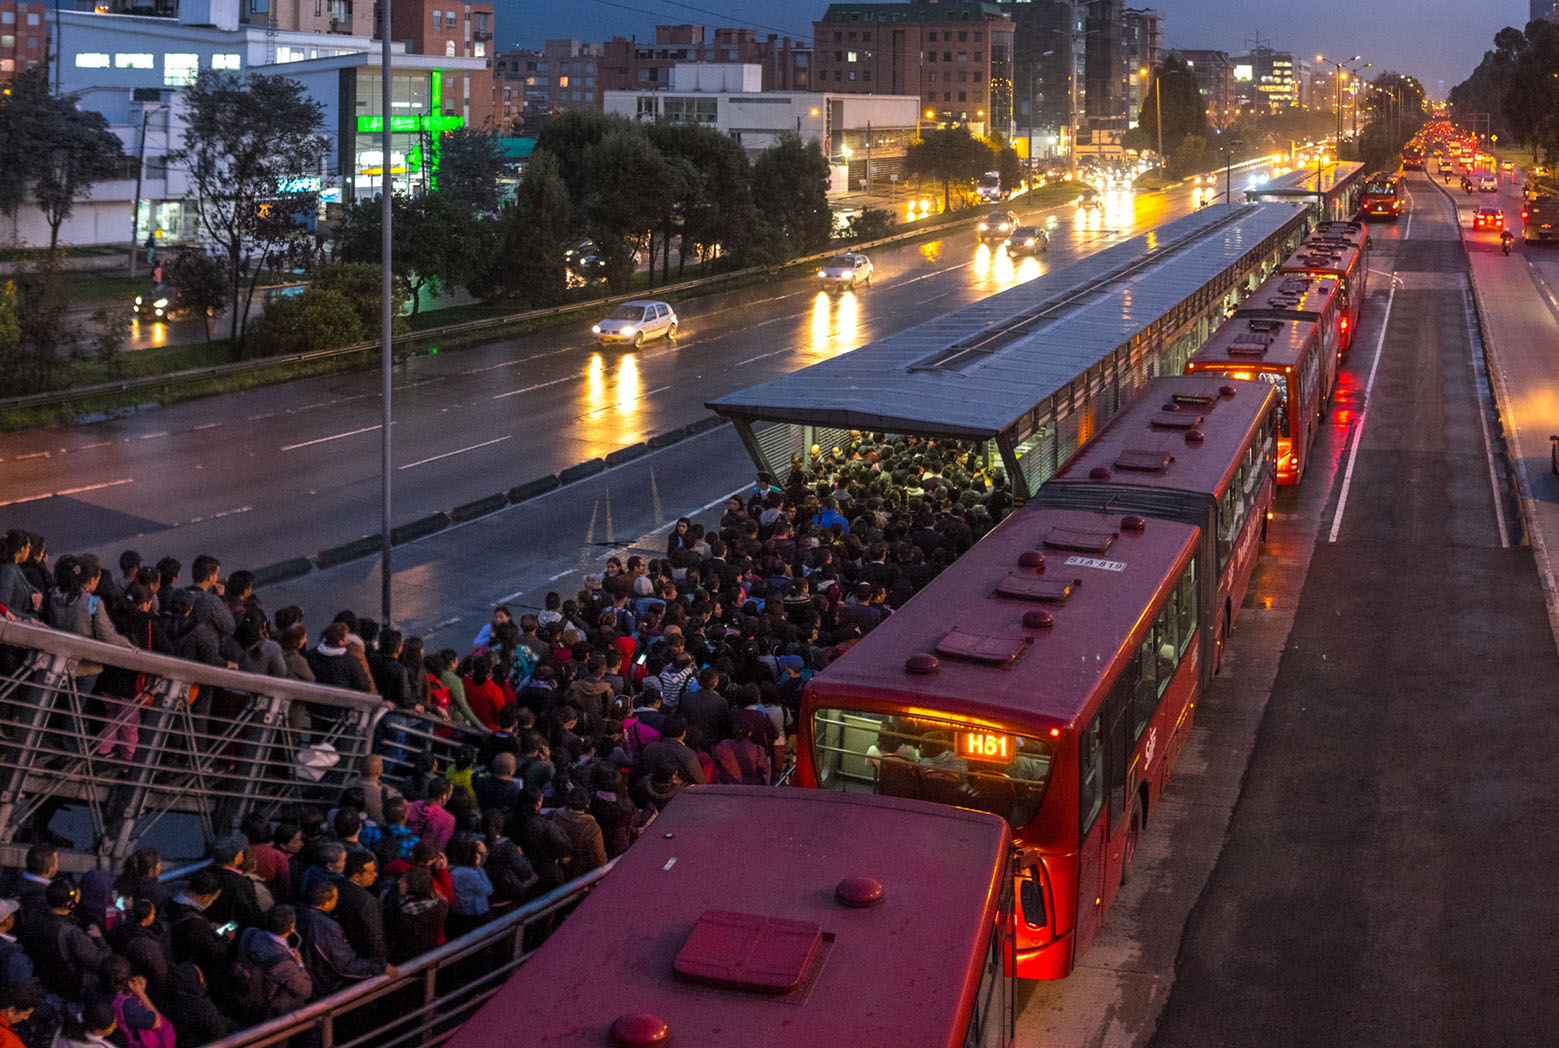
Returning to office 16 years after introducing TransMilenio, the world’s largest Bus Rapid Transit (BRT) system, Enrique Peñalosa was eager to invest in critical upgrades. I was asked to figure out how to make the best use of the funds. After reviewing dozens of previous studies and literature on system dynamics and queuing theory, I synthesized a framework for diagnosing congestion issues and prioritizing remedies. I then worked with Transmilenio to combine field and operational data to conduct a study that would eventually guide $45 million in upgrades over five years.
As in many complex systems, transit networks can behave in counter-intuitive ways. For example, dispatching more buses on popular routes might cause congestion at stations, ultimately reducing capacity. Similarly, adding turnstiles to relieve queues to enter stations can cause overcrowding within them. At critical levels of congestion, passengers at loading bays can block passengers behind them waiting for different routes. Loosely following the graphic language of system dynamics, I mapped out the relationships between various sources of congestion in order to identify detrimental feedback loops.
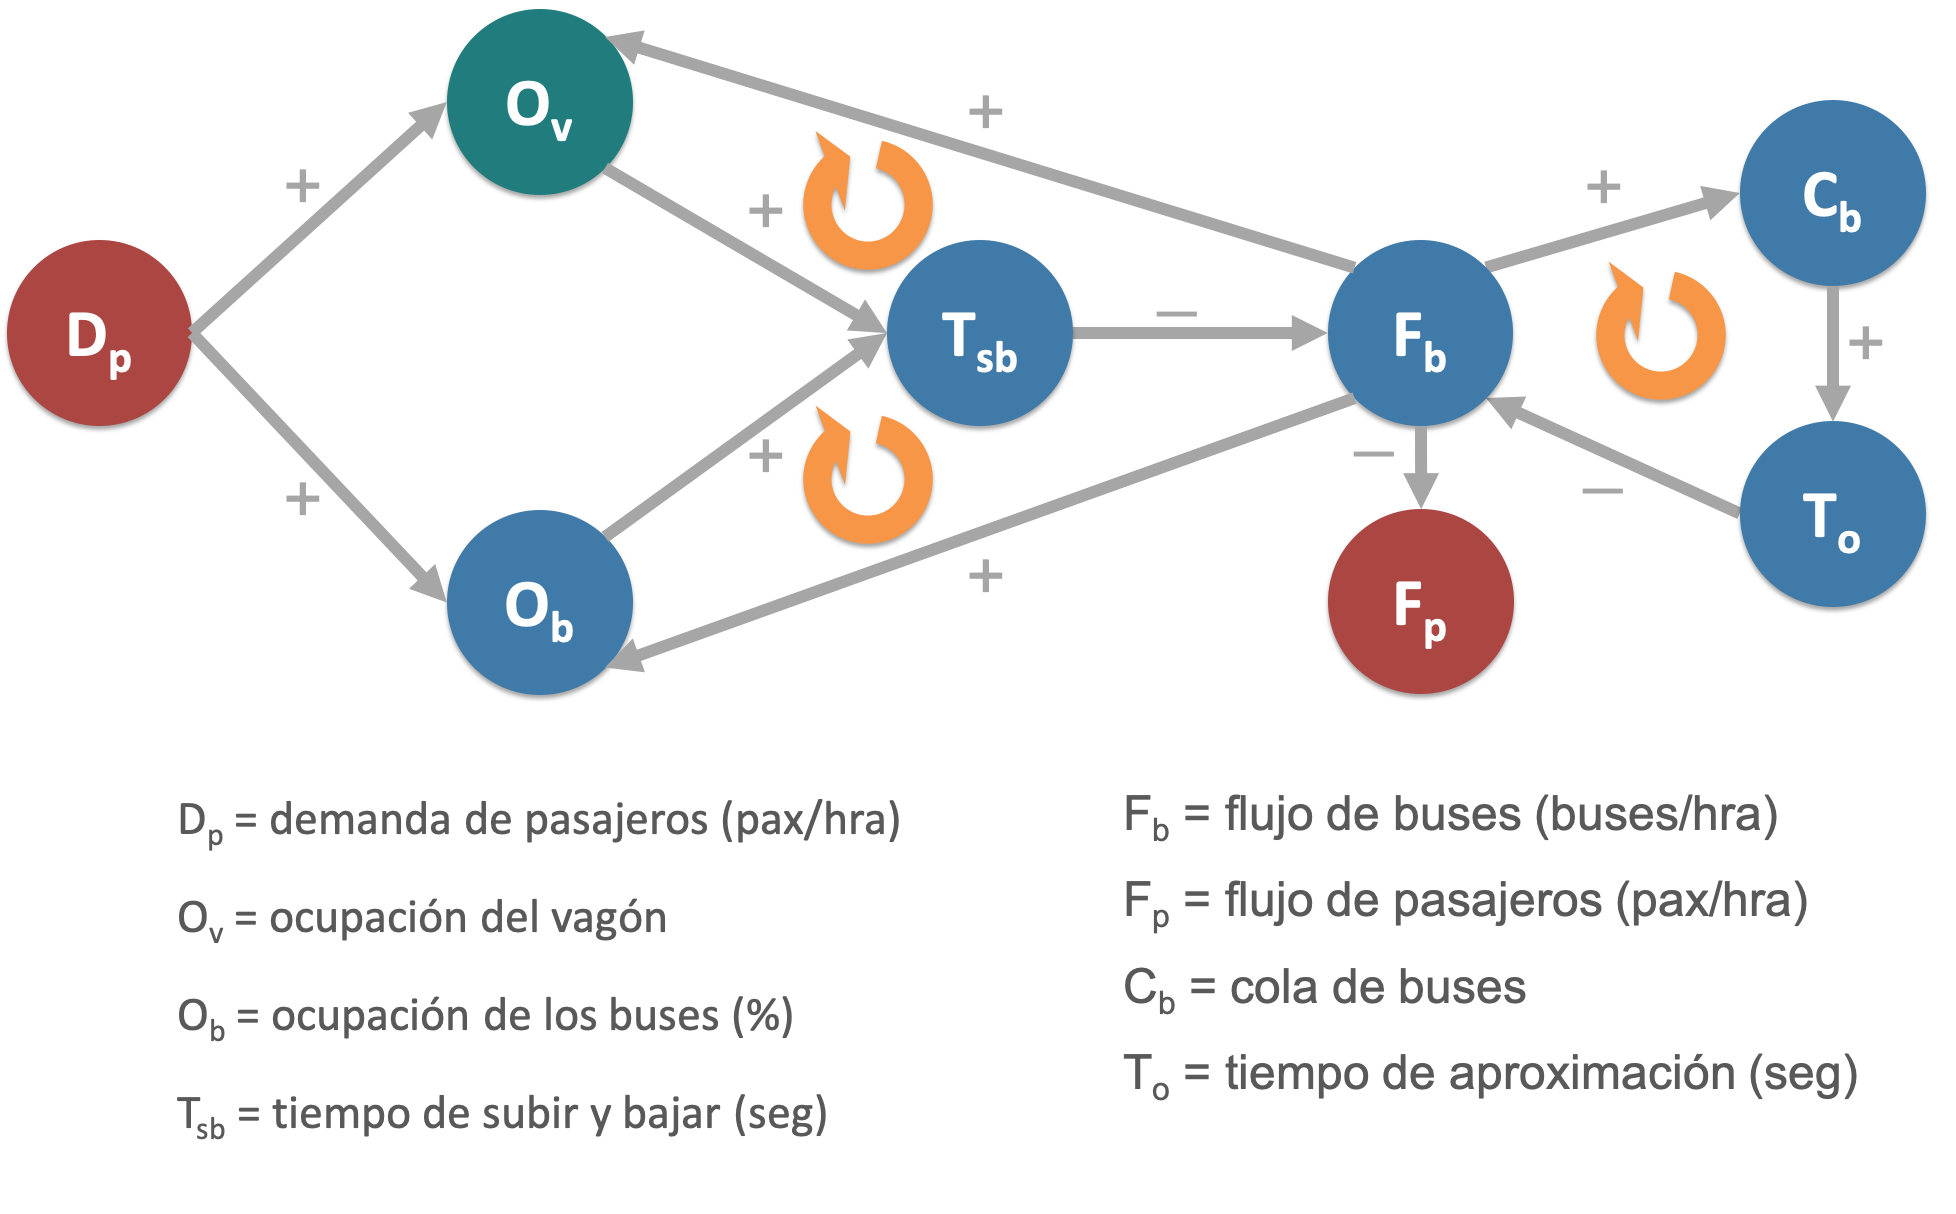
While it was infeasible to capture all of the potential dynamics, I focused on three potential bottlenecks at stations: buses in stations, passengers in loading bays, and passengers at turnstiles. For every combination of saturation level at these bottlenecks, I identified the most appropriate remedies.
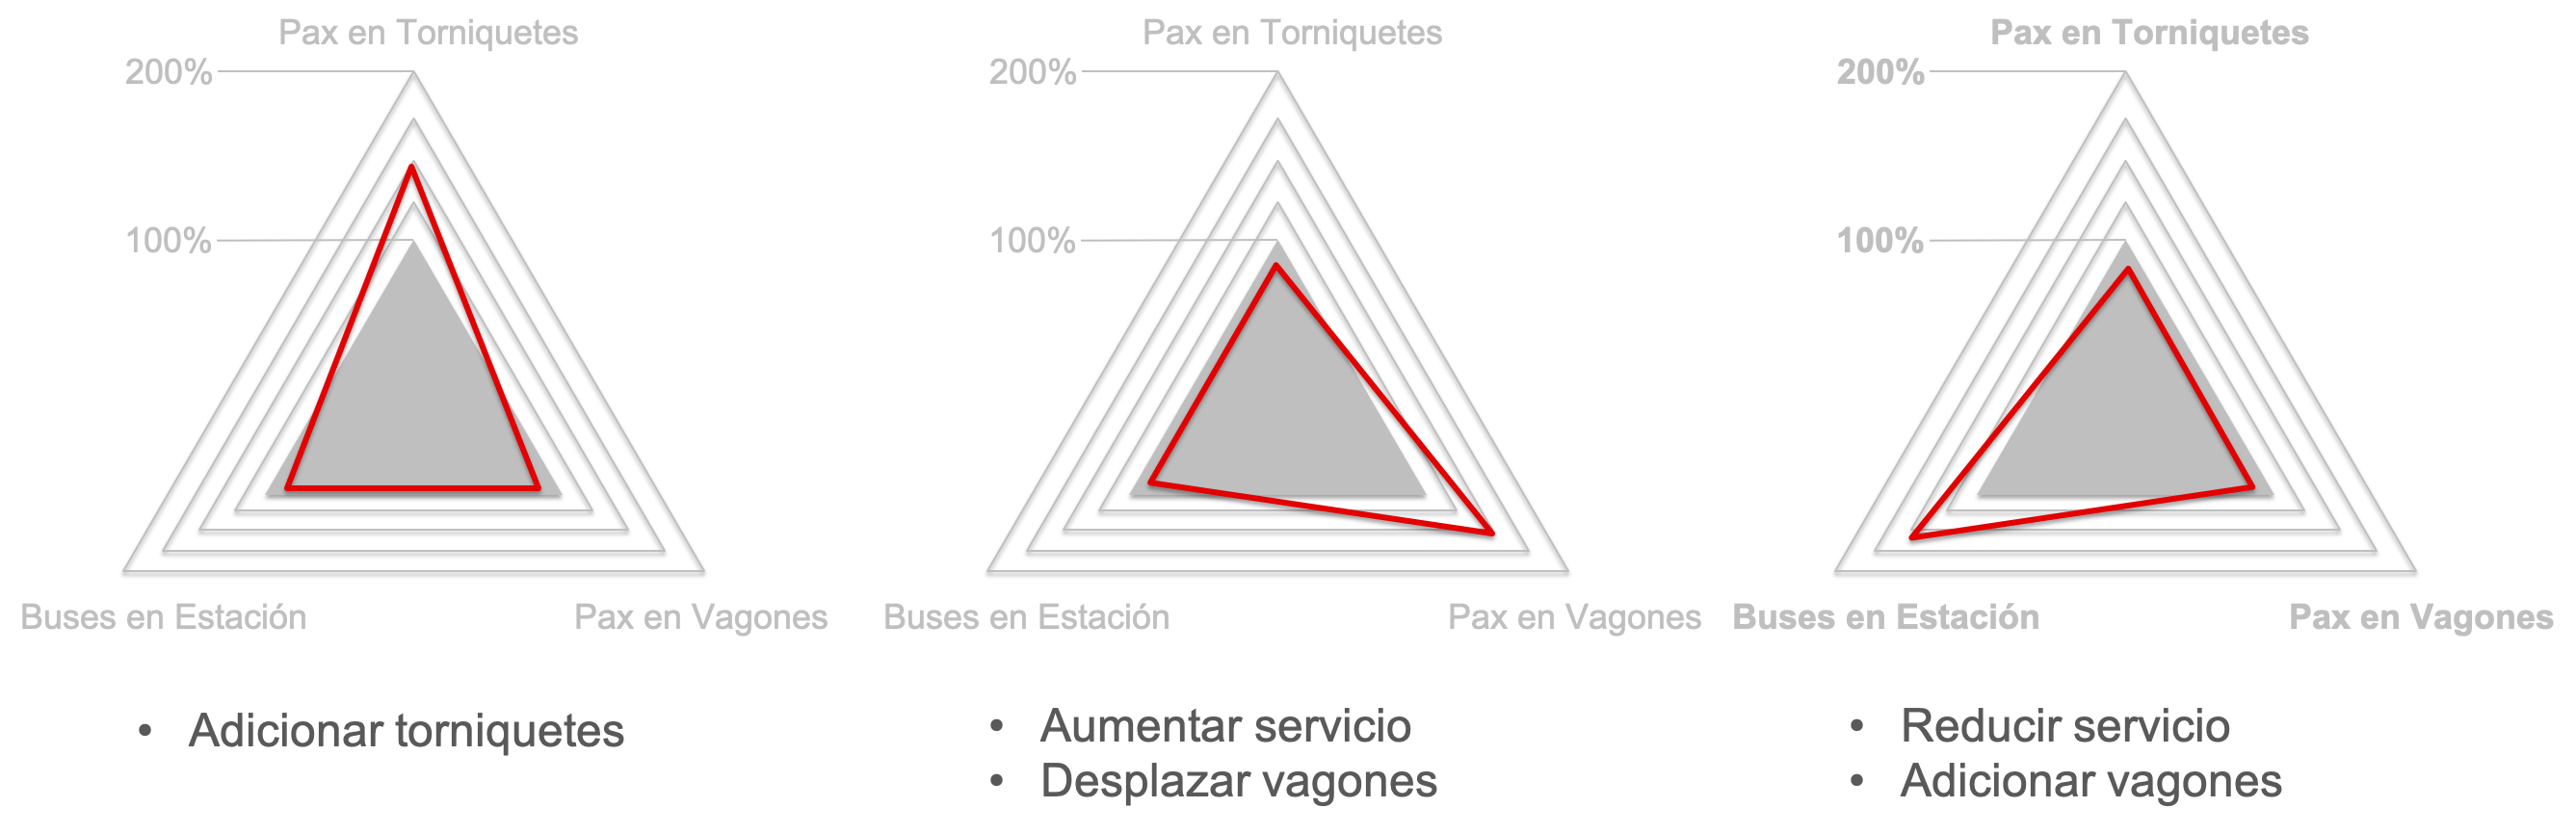
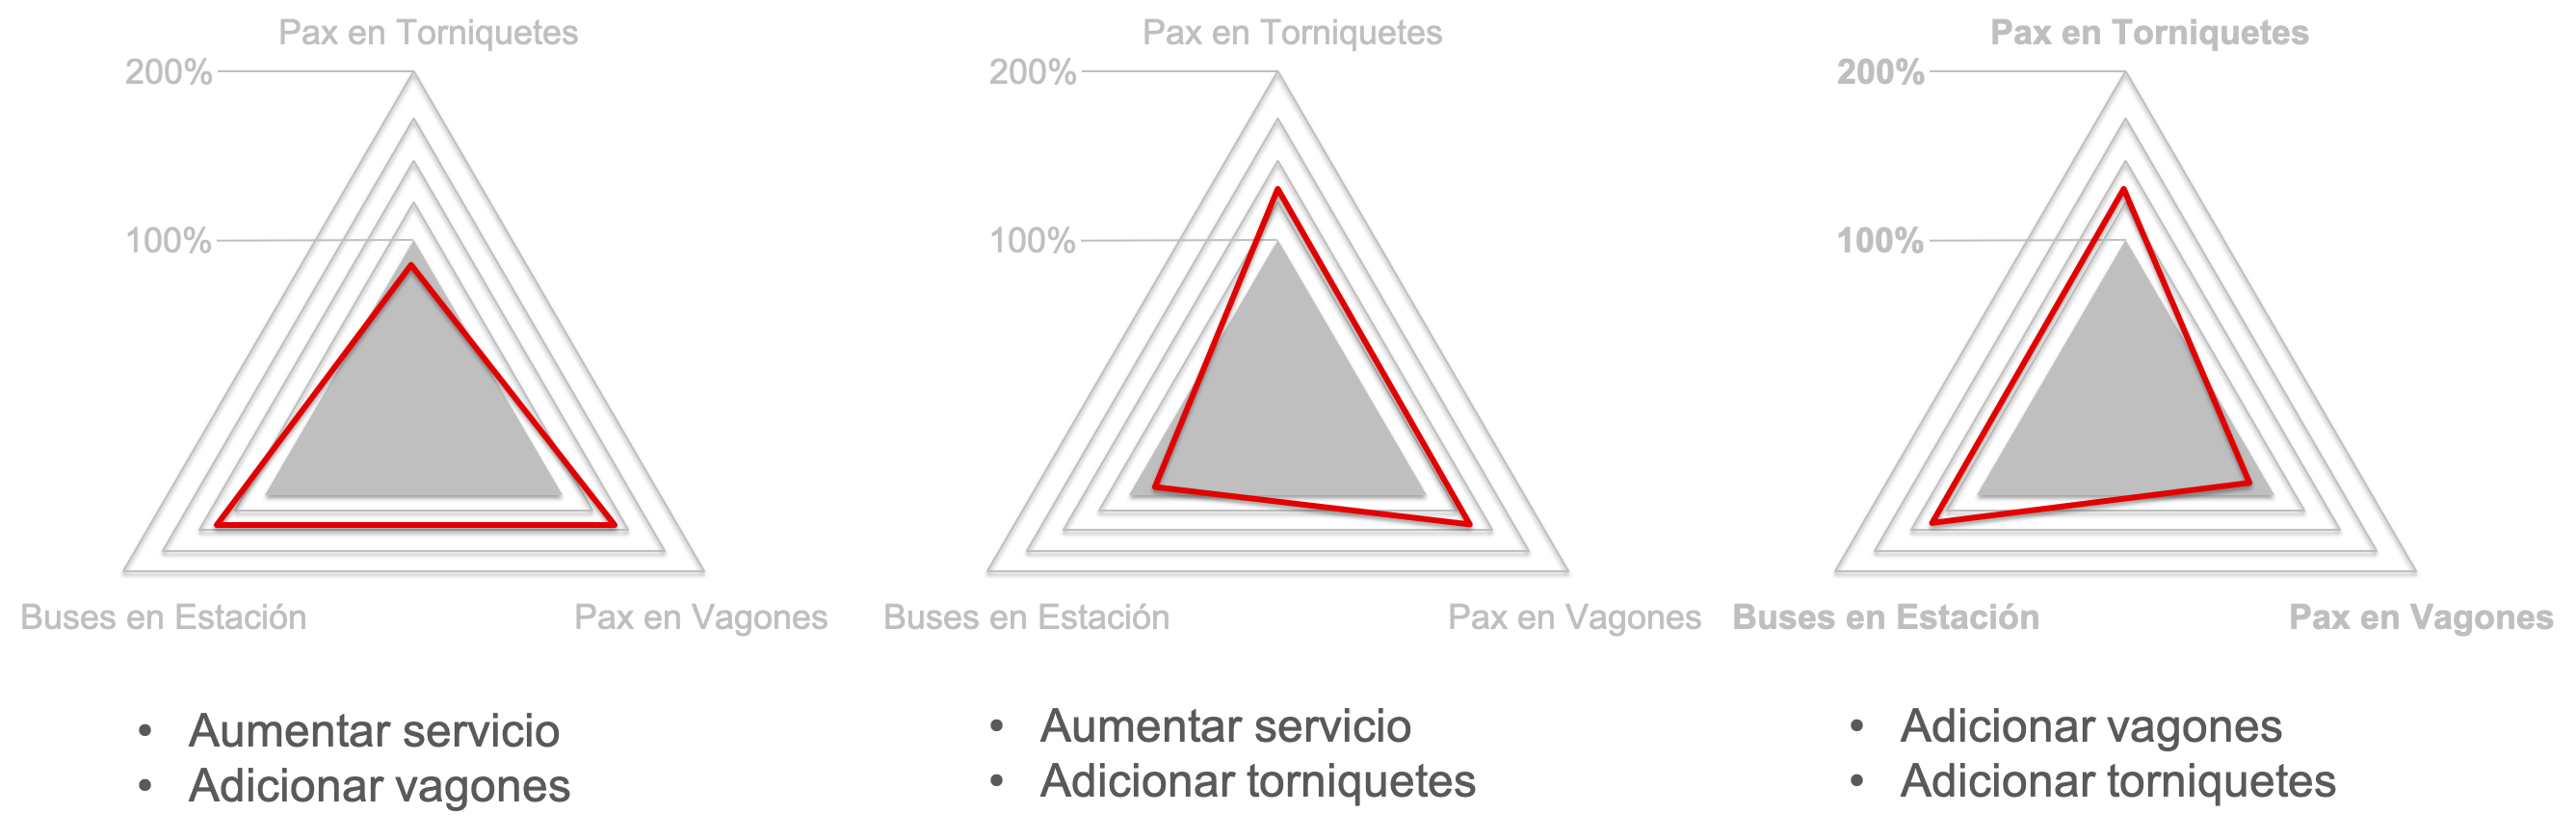
The second row includes the most interesting scenarios where multiple bottlenecks are congested. In the bottom left scenario, where the station generates queues of buses and is over-crowded with passengers, it is necessary to first add new loading areas to the station and then increase bus frequencies before adding any turnstiles. In the bottom right case, where queues form outside of the station but the loading areas are not saturated, turnstiles can be installed immediately without exacerbating congestion.
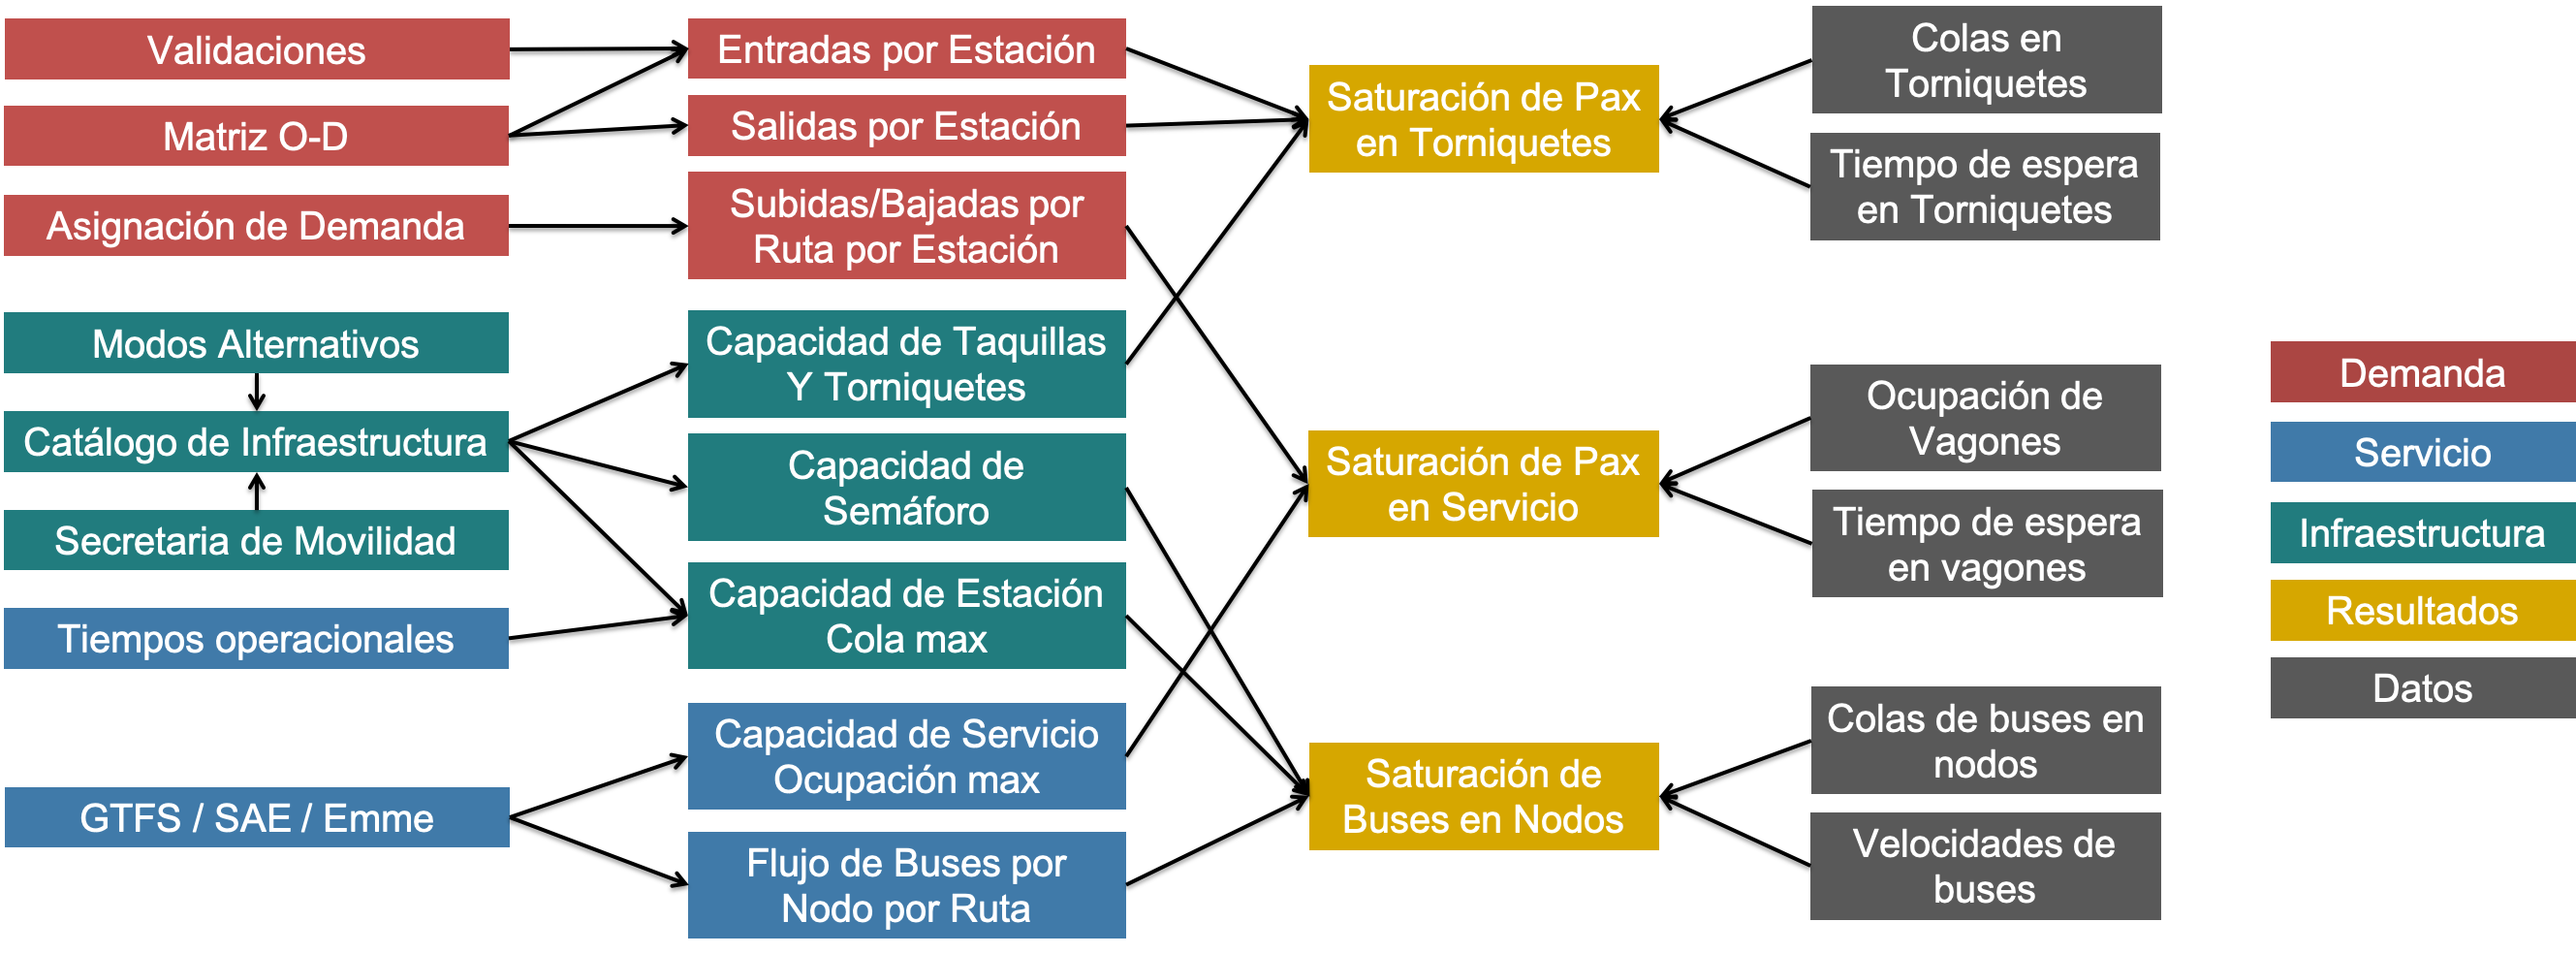
For Transmilenio’s 5-year station upgrade plan, I mapped out how we could fuse available data from smartcard validations, the demand model and system schedules to measure the three types of congestion systematically across stations. To cross check official data, I also had TransMilenio officials collect field data on the 40 most congested stations.
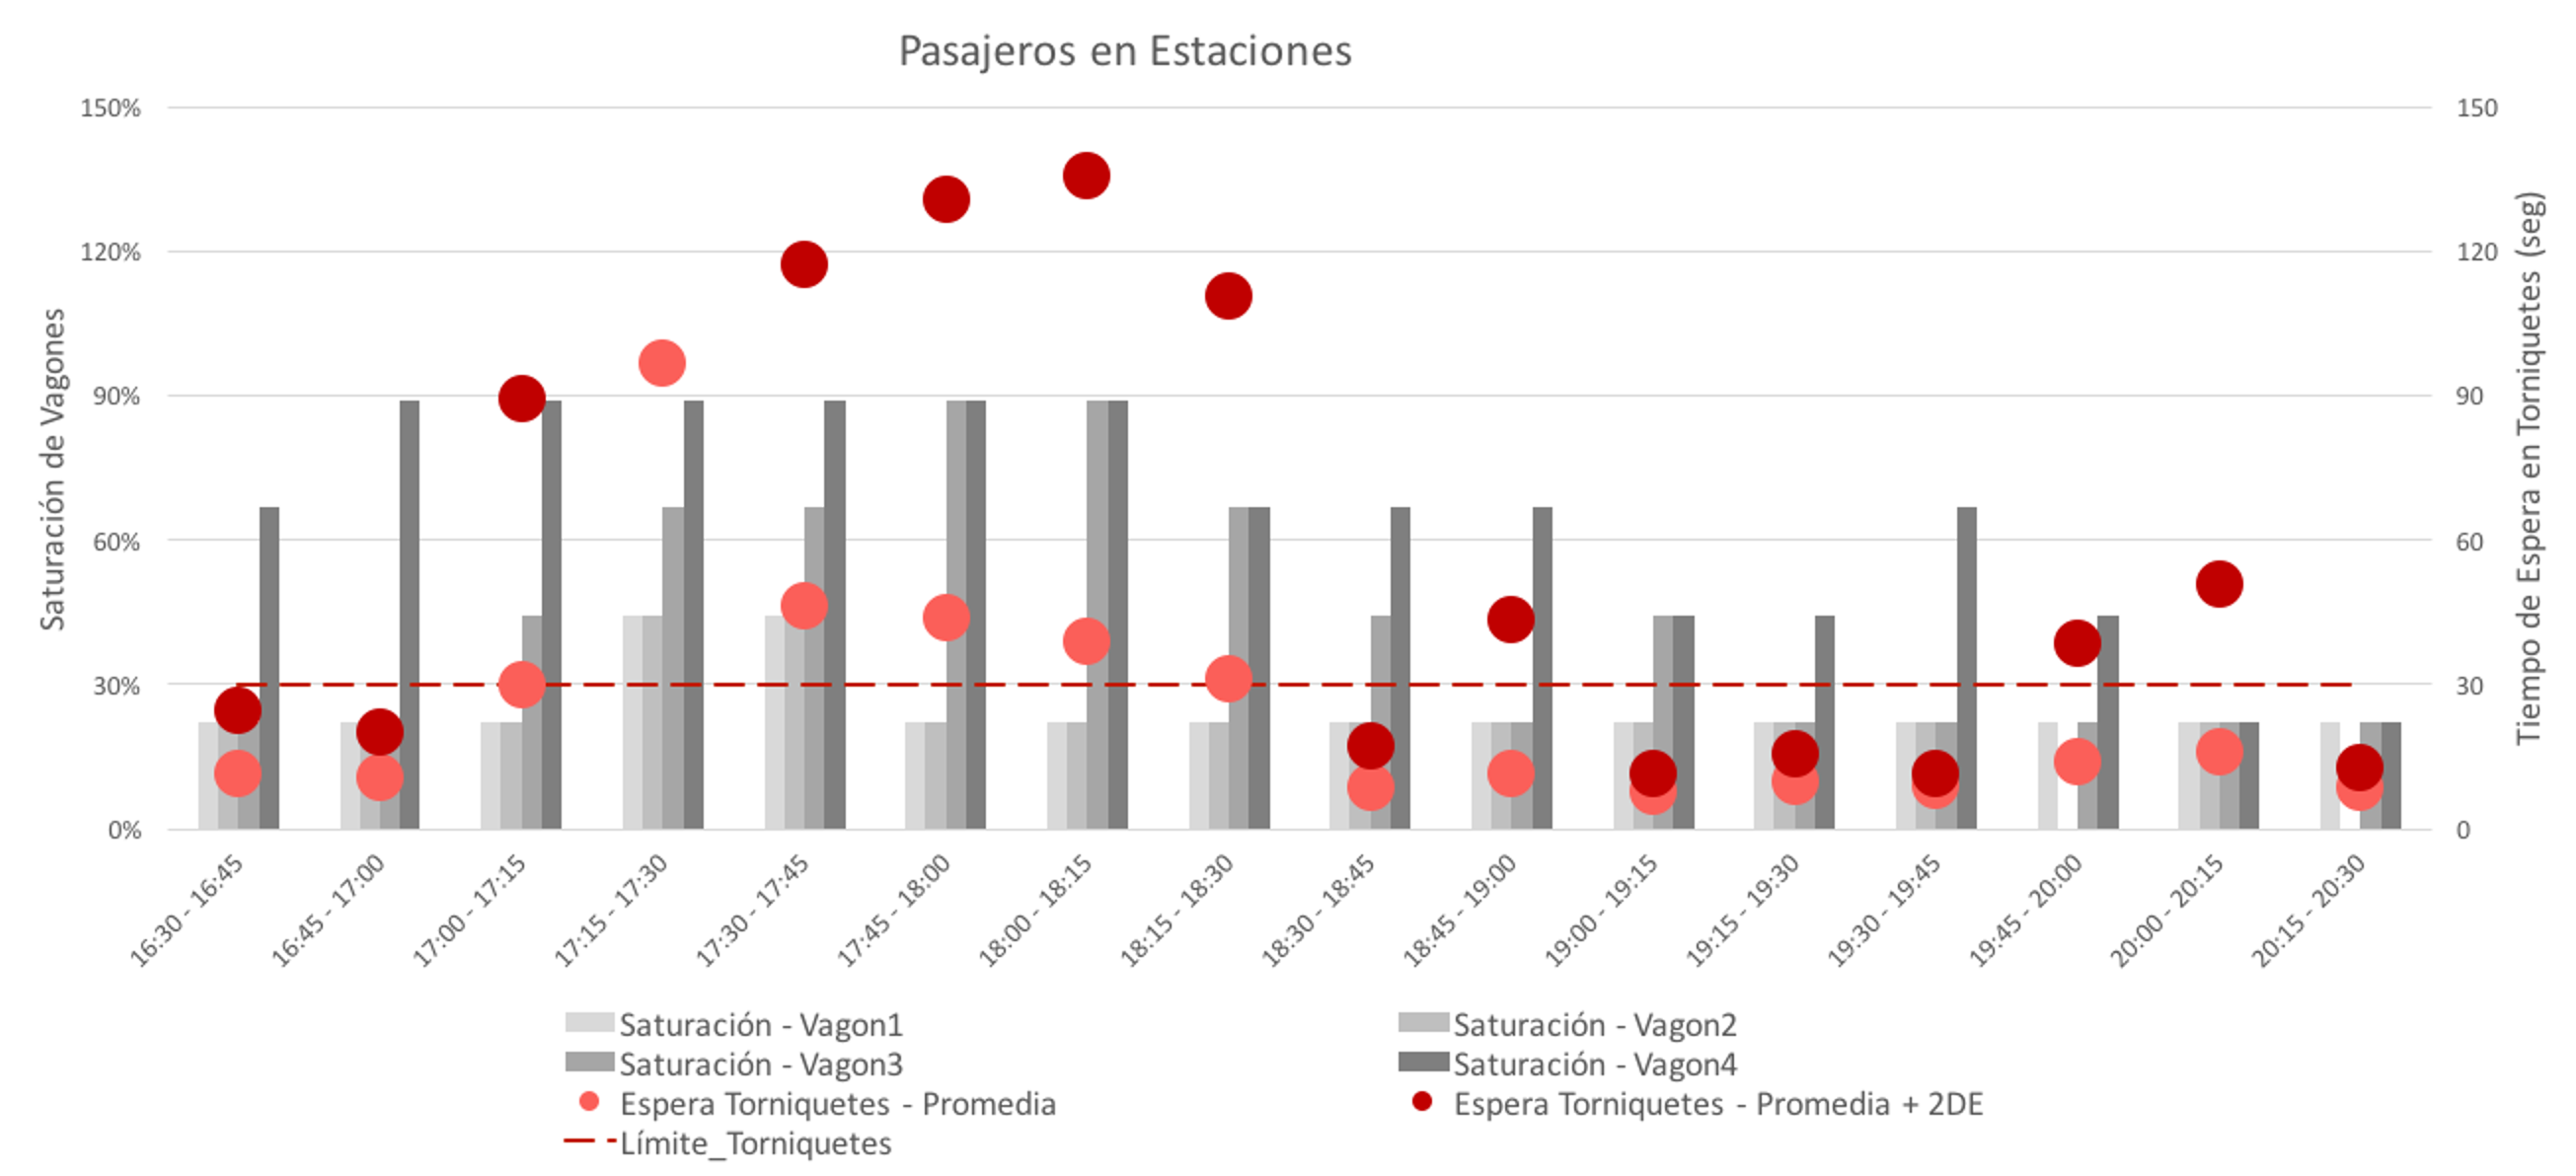
The empirical data showed a variety of congestion conditions across stations and a clear relationship between saturation levels and wait times.
After completing the diagnostic study, I emulated McKinsey’s cost curve for reducing greenhouse gas emissions to prioritize the most cost-effective measures for relieving congestion in TransMilenio’s stations.
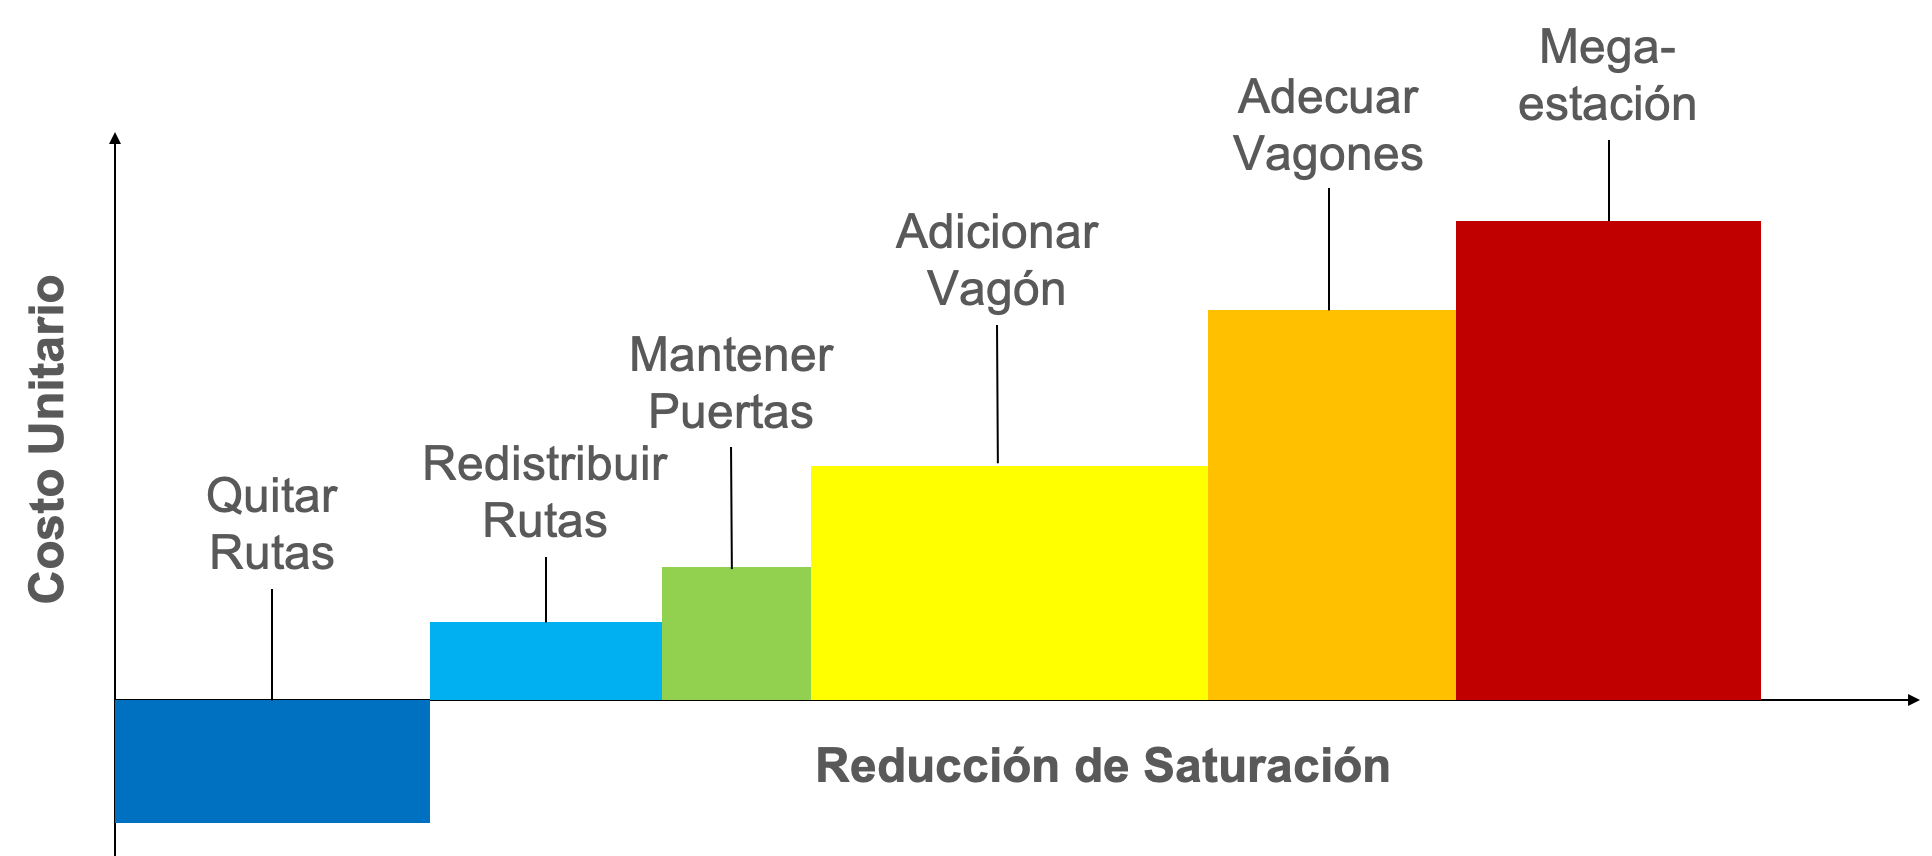
The chart indicates the some of the measures, such as reducing service for unsaturated routes the contribute to queues at stations in blue, reduce costs. Implementing the low-cost measures in light blue to yellow, such as reorganizing routes, maintaining station doors and adding loading bays, could not completely eliminate congestion in all cases. For stations facing all three types of congestion, we recommended new facilities with separated loading bays to accommodate larger buses and wider platforms to prevent critical crowding.
Update
Both demand and supply can be extremely volatile in large transit systems like TransMilenio, so I decided to automate this analysis as an interactive web-based app called HyperionTransit. The app uses standard data such as GTFS, Origin-Destination matrices and Emme modeling outputs to compute various types of saturation levels. I have released the app for non-commercial use on GitHub.
The City of Bogotá continues forward with ambitious plans to expand BRT stations.